

UTA APC Software
On-time performance and ridership, measured.
UTA APC software turns raw on-vehicle records into on-time performance, ridership, running-time, and stop-activity reporting — 60+ reports, processed automatically every night, hosted and supported by UTA. Where a national reporting requirement applies, the same data meets it; in the U.S. that is FTA's NTD.
The platform, in production
Real reports, from real agencies.
Password-protected, cloud-hosted, and built to drill from a system-level summary all the way down to a single observation.
The overnight pipeline
Five processing steps, every night.
Processing starts after the last vehicle returns to the garage and finishes before staff arrive. Each module runs its own data-validity checks, so the output is auditable at every step.
Concatenate
Raw APC records from every vehicle are collected and assembled into a single day's dataset.
Diagnostics
Hardware status, sensor communication, and data-quality checks flag anomalies before they contaminate results.
Automated Assignment
Each bus is matched to the block it actually operated — no manual driver login required.
File Creation
Validated observations are structured into analytic files, with non-revenue door activity filtered out.
Database Load
The finished set loads into the reporting database — complete before staff arrive each morning.
Performance & Ridership Analytics
On-Time Performance Analytics
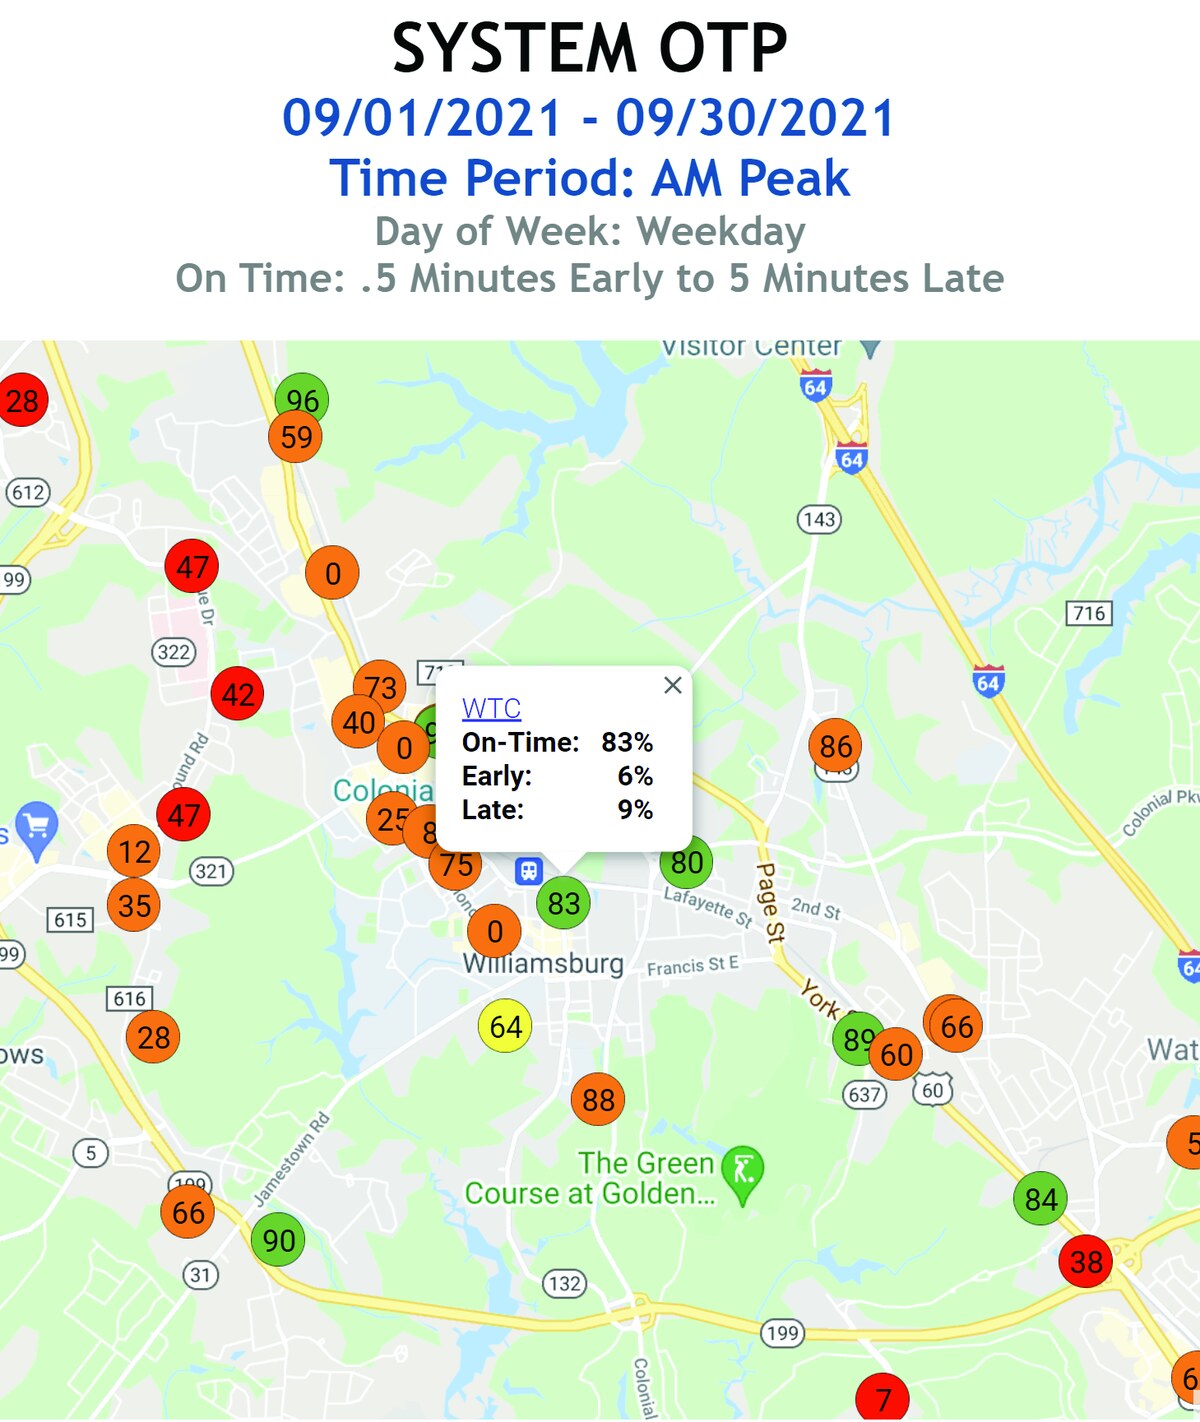
OTP from every vehicle in revenue service, with drill-down by system, route, direction, and timepoint, mapped through Google Maps. Schedule deviation is computed from three measured times: first door open (arrival), last door close, and the moment the vehicle pulls away.
OTP Service Consistency
Goes beyond Early/On-Time/Late buckets to show whether a stop is consistently on time or randomly variable throughout the day, down to the minute.
Running Time & Schedule Adherence
Segment running-time plots compare actual against scheduled running time; schedule adherence reports summarize by system, time period, and timepoint, down to the individual observation.
Bus Stop & Ridecheck Reporting
Automated Ridecheck and Bus Stop Summary reports, including a cumulative-load column, replace manual ridechecks and support accuracy certification.
Reporting
Web-Based Ridership Reporting
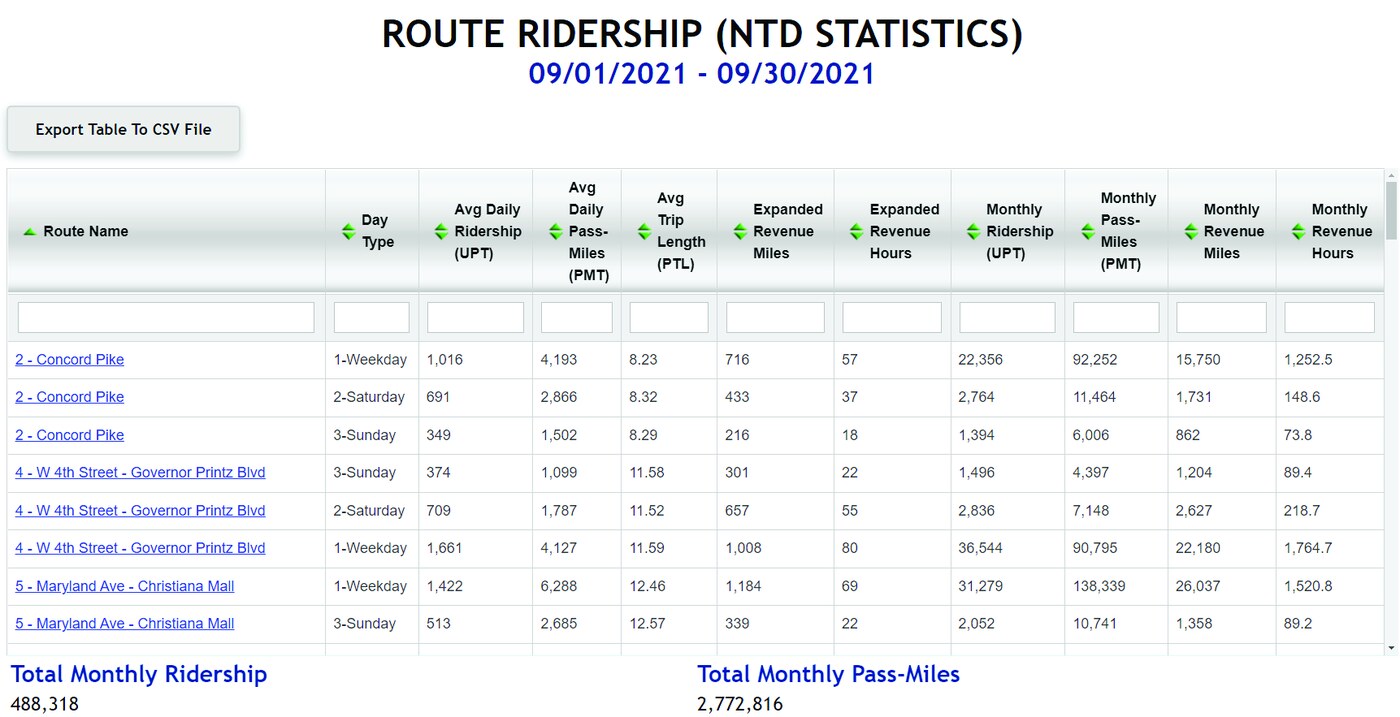
UTA's password-protected reporting site is where the ridership reports live: day-type average and monthly-total UPT, PMT, VRM, VRH, deadhead and total miles/hours for any date range, with drill-down from system summaries to individual observations and one-click CSV export.
National Reporting (FTA NTD in the U.S.)
Processed APC data meets national ridership reporting requirements. In the U.S. that is FTA's National Transit Database: 100% of UTA APC agencies that have applied for NTD approval have received it, with non-revenue door activity filtered out of UPT and PMT automatically.
60+ Standard Analytic Reports
Trip, timepoint segment, schedule adherence, deadhead, productivity, and wheelchair/bike usage reports, exportable to Excel, GIS, Tableau, and more.
Data Processing & Transfer
Automated Overnight Processing
A five-step nightly pipeline -- Concatenate, Diagnostics, Automated Assignment, File Creation, Database Load -- delivers a complete, validated analytics set before staff arrive each morning.
Automated Bus-to-Block Assignment
Automatically determines the block operated by each bus, no manual driver login required.
Data Quality Diagnostics
Every module includes its own data-validity checks, so output is transparent and auditable at each processing step.
Administrative Control & Diagnostics
APC Administrative Control Reports
Proprietary control modules monitor the quality and quantity of APC data being collected and flag what needs attention -- the controls behind three decades of certified ridership reporting. The methods are UTA's own; the output is a data set that holds up to audit.
APC Diagnostics & Exception Reporting
Daily hardware-status totals, anomaly detection, and non-conforming bus exception reports, deliverable via automated email alerts.
Integration & Export
AVL & Scheduling Compatibility
UTA works with virtually all AVL systems and virtually all scheduling systems, and processes APC data from non-UTA counting systems.
GTFS-RT & API Export
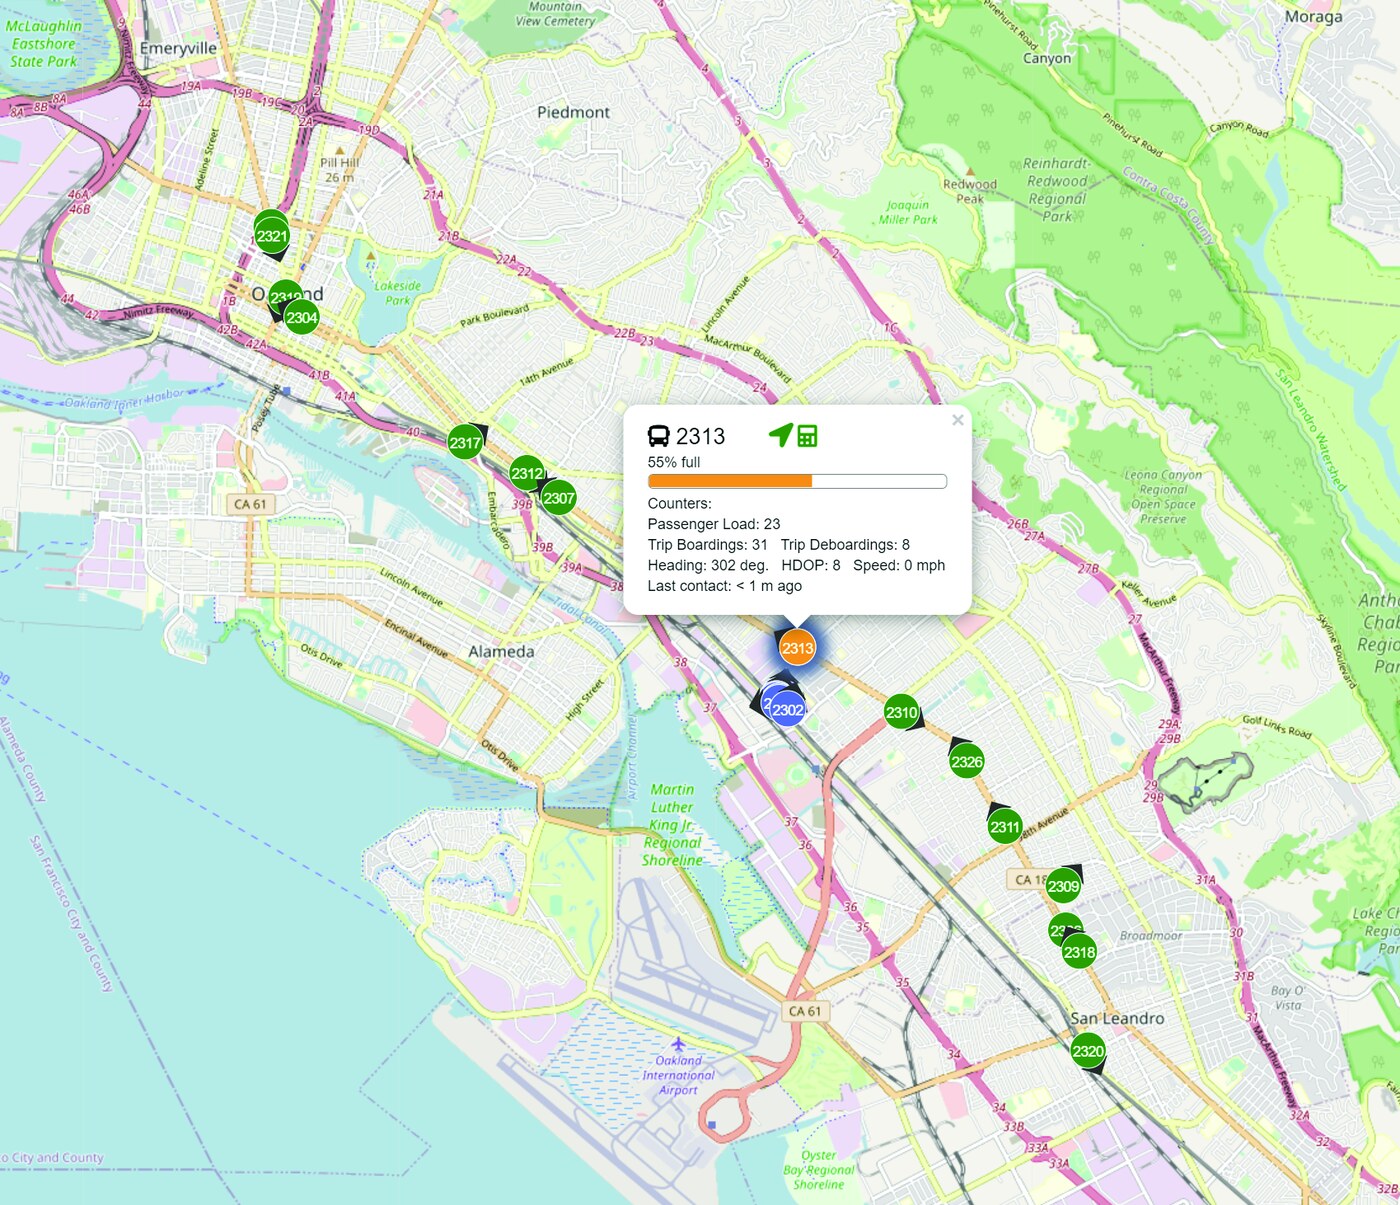
Publishes real-time passenger load and vehicle location as GTFS-RT feeds and REST APIs for rider-facing displays and third-party applications.
Other Features
AWS-Hosted Data Security
All processing, storage, and reporting run in AWS, controlled by security group rules, access control lists, and user/password, 2FA, or SSO authentication -- monitored by a third-party AWS security partner.
Already have an AVL/APC system?
UTA works with virtually all AVL and scheduling systems, processes non-UTA APC data — and diagnoses and remediates underperforming installs.